BRIDGING TRENDS: bridging loan volume soars in Q2
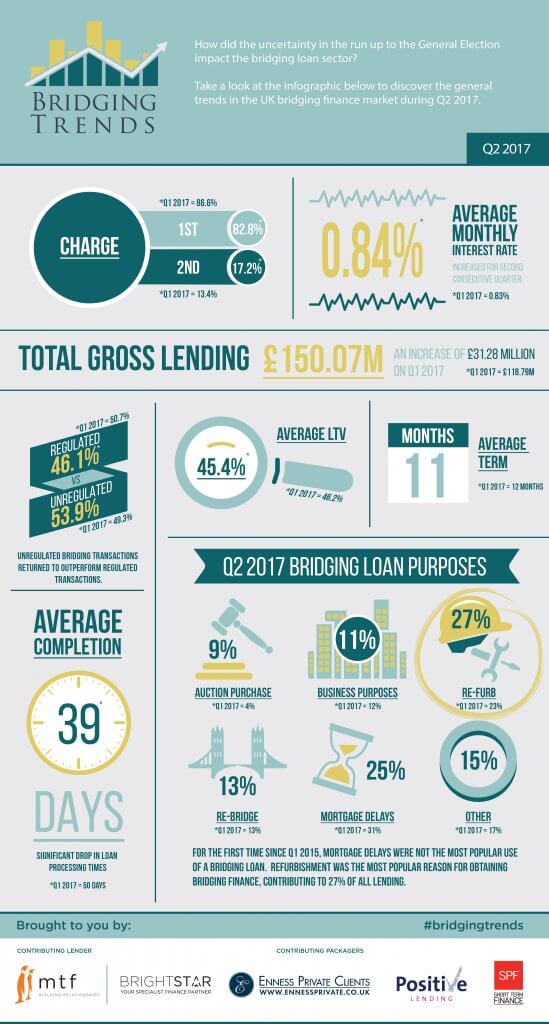
Bridging loan activity peaked to £150.1m during the second quarter of 2017, a 26% increase on first quarter gross lending and the highest level since Bridging Trends launched.
Bridging Trends, a quarterly publication by bridging lender mtf and specialist finance brokers Brightstar Financial, Enness Private Clients, Positive Lending, and SPF Short Term Finance, launched in 2015 to monitor volume and general trends in the bridging finance market.
Activity during the second quarter of 2017 rocketed as bridging lenders brushed off potential volatility from Brexit and the UK general election to fulfil borrowers funding needs and fill a liquidity gap left by mainstream lenders.
However, average Loan-To-Value (LTV) levels dropped to a new low of 45.4% during Q2 2017, the lowest level since Q1 2015 as borrowers and lenders both took a more conservative approach.
Average monthly interest rates rose for the second consecutive quarter to 0.84%, from 0.83% in the previous quarter, but were lower than 0.88% during Q2 2016.
Refurbishments were the most popular reason for obtaining a bridging loan in Q2 2017, contributing to 27% of all lending as borrowers added value to existing and newly purchased properties.
Mortgage delays were the second most popular reason for getting a bridging loan at 25%. This is the first time since Q1 2015 that mortgage delays were not the most popular reason for obtaining bridging finance.
Unregulated bridging loans accounted for 53.9% of lending in Q2 2017, compared to 49.3% in Q1 2017, reversing the 1st quarter blip where regulated loans exceeded unregulated loans. Aside from Q1 2017, unregulated loans have dominated the landscape, since Bridging Trends started.
The average completion time of a bridging loan application decreased by 11 days in the second quarter to 39 days, compared to 50 days in the first quarter. This is consistent with the increase in unregulated activity, which typically has faster processing times.
Second legal charge lending increased to 17.2% of all loans during Q2 2017, up from 13.4% in Q1 2017, 16% in Q2 2016 and 14.9% in Q2 2015.
The average term of a bridging loan was 11 months during the second quarter, down from 12 months in the previous quarter.
Key data points from Bridging Trends in Q2 of 2017 are as follows:
- Contributor lending reaches record high at £150.1m
- LTV levels hits new low of 45.4%
- Average completion time quickens
- Unregulated bridging loans return to outperform regulated transactions
- Refurbishment most popular reason for accessing a bridging loan
Demand for specialist finance remains strong. Notwithstanding a slight increase in the average monthly cost of credit to the consumer, which is up for the 2nd consecutive quarter.
Most interesting however, for the first time since reporting began, mortgage delays are not the most popular use of a bridging finance loan, having been replaced by refurbishment. Whilst it is too early to form any conclusions this may be indicative of a shift in the market, coming off the back of recent increases in stamp duties, and the changes to tax relief on buy to let property, more investors in this quarter focused on adding value to their existing investment properties.
To view Bridging Trends Q2 2017 infographic, please visit www.bridgingtrends.com


