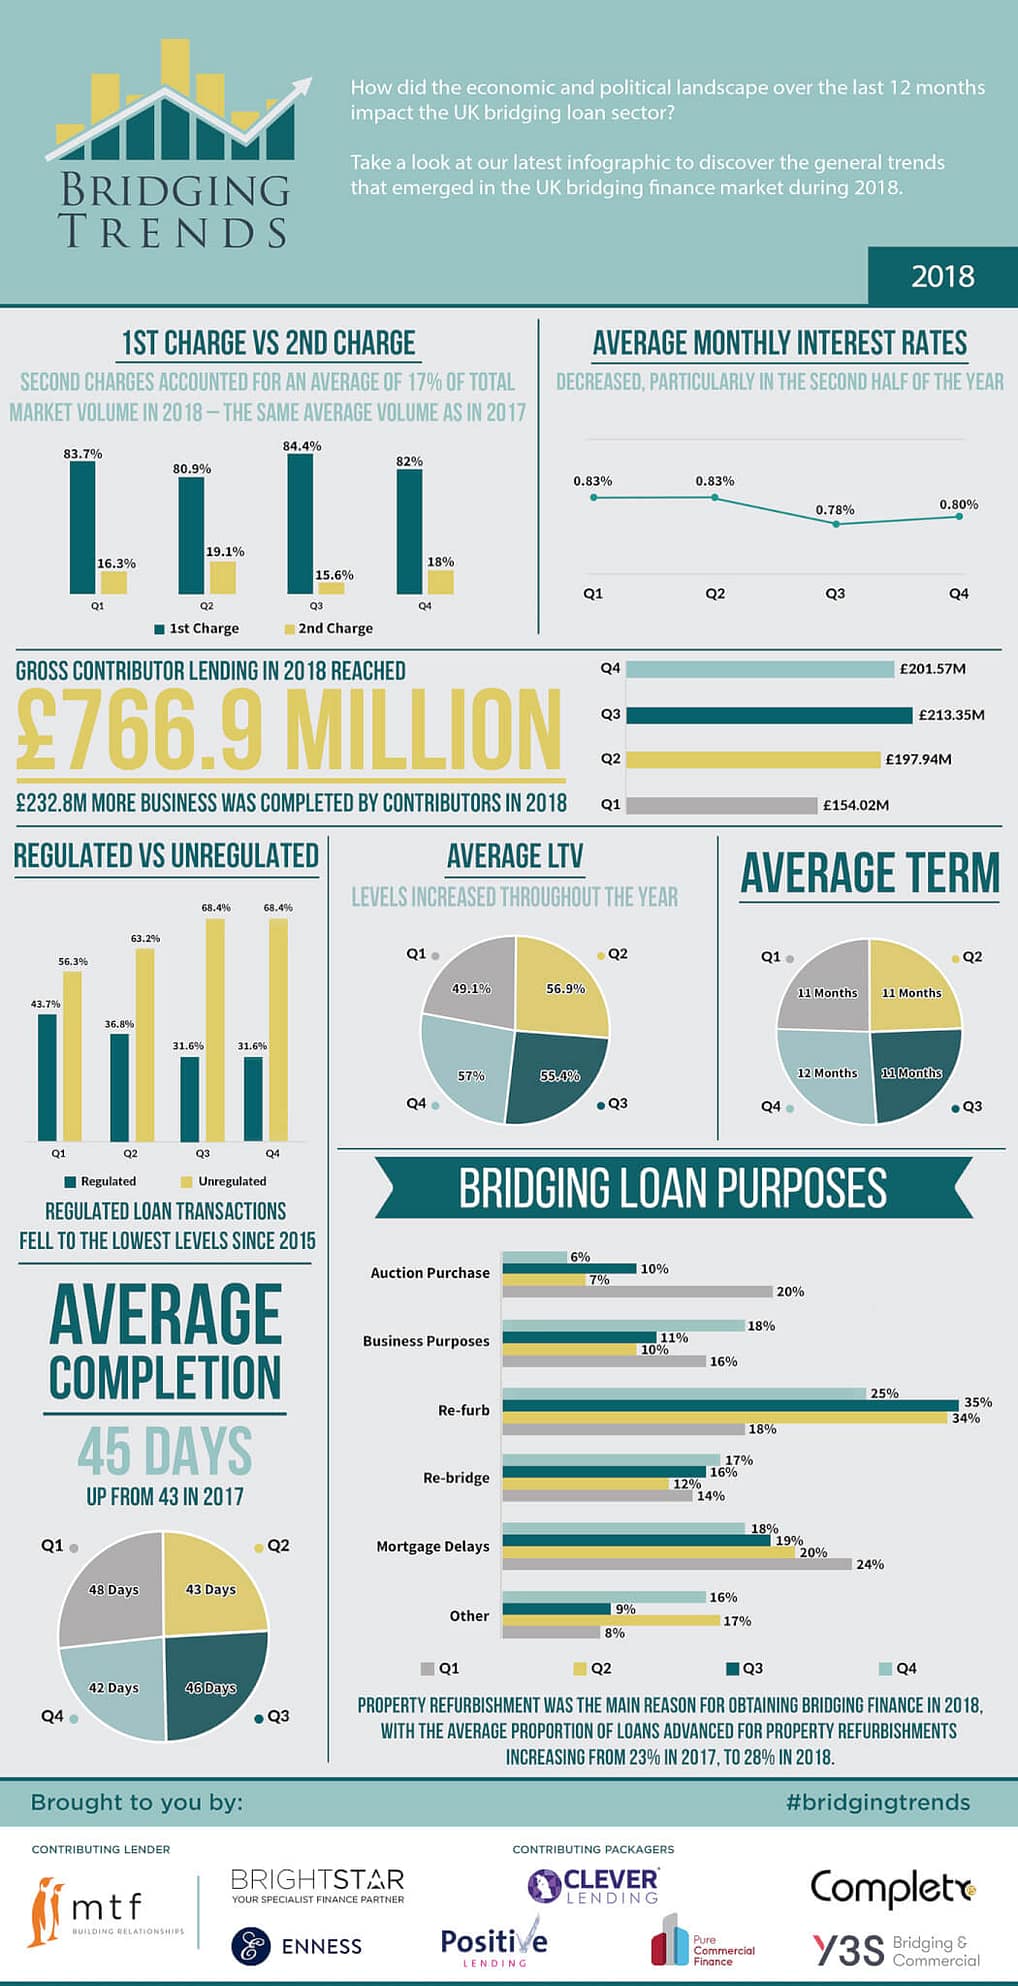
Despite the turbulence in the financial markets, bridging finance displayed positive development in 2018 and maintained favourable liquidity, particularly in the second half of the year, according to the latest Bridging Trends data.
Bridging loan volume transacted by contributors hit £766.9 million in 2018, an increase of £232.8 million on the previous year. This is the highest annual gross lending figure to date and comes as four new contributors joined Bridging Trends in 2018: Clever Lending, Complete FS, Pure Commercial Finance, and Y3S.
The split between 1st and 2nd legal charge bridging loans remained consistent throughout 2018, with first charge loans accounting for 83% of the market in all four quarters. Second charges accounted for an average of 17% of total market volume in 2018 – the same average volume as in 2017. In 2016, 18% of bridging loans transacted by contributors were second charges.
A significant portion of bridging loan activity was unregulated in 2018, at an average of 64% of all transactions. Whilst regulated bridging loans decreased market share on previous years to an average of 36% in 2018, compared to 46% in 2017, 44% in 2016, and 37% in 2015.
Average loan-to-value levels increased in 2018 to an average of 55%, from 47% in 2017, and 49% in 2016. This could be attributed to higher LTVs being made available by new entrants in the space.
Average monthly interest rates continue to fall year on year, demonstrating how bridging finance has become cheaper. The average monthly interest rate in 2018 was 0.81%, lower than in 2017 (0.83%) and 2016 (0.85%).
Funding property refurbishments was the most popular reason for obtaining bridging finance in 2018, with the average proportion of loans advanced for property refurbishments increasing from 23% in 2017, to 28% in 2018.
Demand for bridging loans taken out for business purposes also increased in 2018, increasing on average from 12% in 2017, to 14% in 2018.
2018 was evidently a year where borrowers decided to opt for fast and flexible bridging loans to make improvements to properties and bolster yields, against the backdrop of Brexit uncertainty and legislation that has made it tougher to purchase new properties. Consequently, bridging loans for mortgage delays fell in every quarter in 2018.
The average loan term in 2018 was 11 months. down from 12 months in 2017. The average completion time of a bridging finance application averaged 45 days in 2018, up from 43 days in 2017. Average loan completion times were also 45 days for the year in 2016.
To view the Bridging Trends 2018 infographic, please visit www.bridgingtrends.com

