Figures from Bridging Trends confirms the UK bridging loan market is bouncing back, with Bridging Trends contributors reporting a total of £190.24m in bridging loans transacted in Q3 2021, a significant jump from the £146.52m the previous quarter and an annual percentage increase of 65% (Q3 2020 £115.52m).
This surge is attributed to strong housing market activity ahead of the tapering of the stamp duty holiday and is the highest volume seen since Q4 2018’s, £201.57m.
Bridging Trends combines bridging loan completions from several specialist finance packagers operating within the UK bridging market: Adapt Finance, Brightstar Financial, Capital B, Clever Lending, Complete FS, Enness, Finanta, Impact Specialist Finance, LDNfinance, Optimum Commercial, Sirius Group, and UK Property Finance.
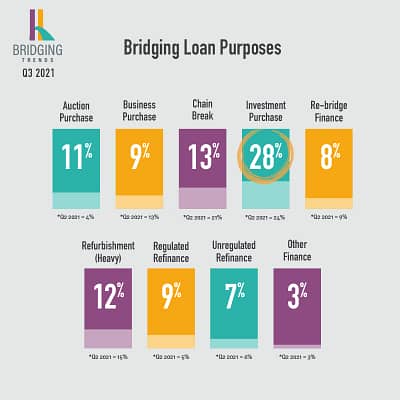
Bridging Loan Purposes
For the second consecutive quarter the purchase of an investment property was the most popular use for a bridging loan, at 28% of total contributor transactions – up from 24% in Q2.
Chain break was the second most popular use at 13%, a drop from 20% in Q2. Meanwhile, demand for auction finance surged from 4% in Q2 to 11% in Q3.

Average LTV
The average LTV in Q3 jumped to 60.2%, up from 54.9% LTV in Q2 – this is the highest average LTV ever recorded since Bridging Trends launched in 2015, illustrating that borrowers are maximising liquidity opportunities and taking advantage of low rates to leverage more than before.
Demand for higher LTV products was also a sentiment reflected in data provided by Knowledge Bank, which reported the top criteria search made by bridging finance brokers on their system in Q3 was “maximum LTV”.
Transaction Breakdown
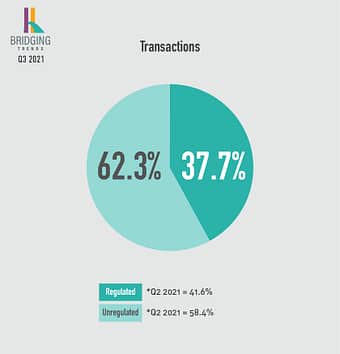
Second charge bridging loan transactions remained unchanged from the previous quarter, accounting for 10% of total market volume in Q3. Whilst regulated bridging loans transacted by contributors decreased market share for the fifth consecutive quarter – falling to 38%, from 42% in Q2.

Average Monthly Interest Rate
The average monthly interest rate in Q3 2021 was 0.72%, down from 0.79% in Q2, highlighting the large levels of liquidity in a continually competitive space.
Average Term & Time
The average term of a bridging loan in Q3 fell from 12 months to 11. Bridging loan processing times returned to Q1’s record high of 53 days, up from 47 days in the previous quarter.
The latest Bridging Trends figures show how the bridging market has pulled back from the disruption caused by the Coronavirus pandemic (albeit the longer processing times) and that investor appetite for UK property is returning. Yet, despite the positive figures, macro-economic conditions remain uncertain, and several factors could still impact the longevity of the sector’s recovery. It will be interesting to see how the sector performs now that the Stamp Duty holiday has fully tapered off.
For more information, or to view the Bridging Trends Q3 2021 infographic, visit www.bridgingtrends.com.
